
I may not have much experience in typesetting or programming in Scheme, but I think it would be beneficial for someone well-versed in the internals of TeXmacs to outline a roadmap for implementing commutative diagram support. This way, individuals like me who are interested in this feature could gradually explore the existing codebase, familiarize ourselves with the requirements for implementing the roadmap, and potentially contribute to realizing this feature  .
.
Challenge: create support for commutative diagram
@mafty Welcome to our forum!
There are at least three ways to create commutative diagrams in TeXmacs.
-
If you are already familiar with the fantastic tool quiver, the
quiver-plugin would be an excellent choice. You can download it here and install it into TeXmacs yourself. Additionally, the plugin is built-in to Mogan. -
While TeXmacs doesn’t have a specific
TikZ-cd-plugin, it does offer built-inTikZ- andXY-pic- plugins, both of which are traditional tools in LaTeX for drawing commutative diagrams. -
The built-in graphics tools are also very well-designed for various graphics, including commutative diagrams. Despite some imperfections, they are more than sufficient for daily use. I recommend you read Chapter 8 of The Jolly Writer or watch Joris’ tutorial to familiarize yourself with this wonderful tool.
You can choose any of these options according to your preferences. Additionally, a student participating in Mogan Summer of Code is working on improving the graphics tools, with one of the goals being to enhance the functionalities of commutative diagram drawing. Feel free to submit issues with your suggestions to Mogan. Your contributions are welcome!
Hi, @xuyiqi.
In my opinion, having built-in support for commutative diagrams represented as native tree structures is much more preferable. As far as I know, the diagrams produced by the quiver plugin and tikz/xy-pic plugins rely on inserting binary files generated by external programs.
I have also experimented with the built-in graphic tools, but they necessitate manual placement of anchors and arrows using the mouse, which compromises the scalability of the approach.
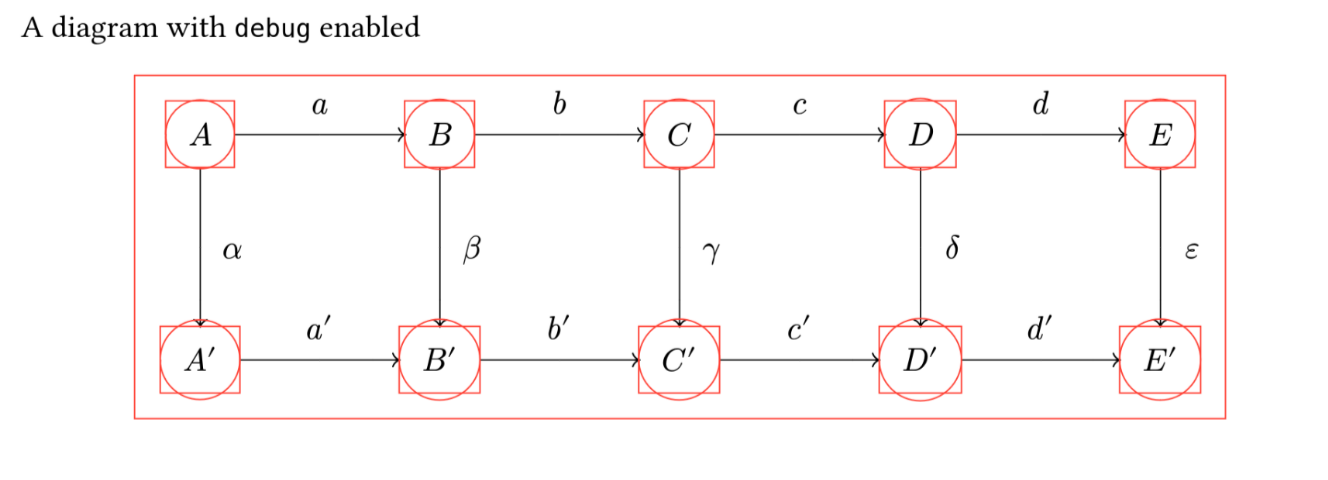
This is a screenshot from the pdf document produced by https://gitlab.com/giacomogallina/typst-cd.
Is there someone knowledgeable about the typesetting engine who could provide guidance on the following:
- How can I obtain geometric information similar to the rectangular bounding boxes for an inline math environment (such as
A'in the example)?
Based on the screenshot provided, it appears that by determining the geometry of all these bounding boxes, we could develop an algorithm to automatically calculate the start and end positions of arrows connecting them.
I would like to attempt a minimal example where I connect two inline math environments with an arrow, with the start and end positions of the arrow computed automatically. Any insights or suggestions would be greatly appreciated.
I guess that this (connecting two inline math environments) would make things more complicated than necessary, if I understand correctly.
I don’t know anything about typst-cd, but my current understanding of XYpic is that, the grid (i.e. the horizontal and vertical distances) are fixed, not computed, that is to say, it does not adapt to contents, and when the distances are not good, users have to adjust them manually.
Hi @re4zuaFe,
I haven’t used xypic in LaTeX before. However, according to my experience of using tikzcd, by default the centers of the vertices are arranged in a grid, but the algorithm would automatically figure out
- the best way to place arrows between them, so there is a consistent spacing around the formulas at the vertices.
- the horizontal and vertical distances in the grid
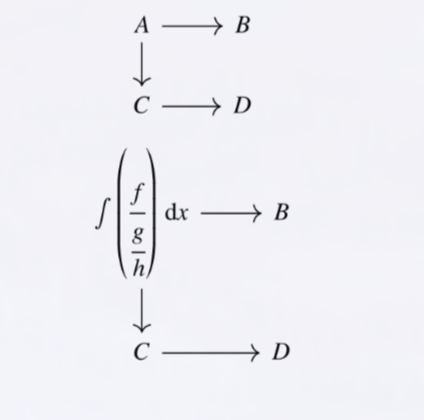
Here is a minimal example using tikz-cd:
 \begin{displaymath}
  \begin{tikzcd}
    A\ar[r] \ar[d] & B \\
    C \ar[r] & D
  \end{tikzcd}
\end{displaymath}

\begin{displaymath}
  \begin{tikzcd}
    \int \left( \cfrac{f}{\cfrac{g}{h}} \right) \, \mathrm d x \ar[r] \ar[d] & B \\
    C \ar[r] & D
  \end{tikzcd}
\end{displaymath}
which produces the following diagrams with distinct grid sizes and arrow lengths:
I wholeheartedly agree that having built-in support for commutative diagrams is the preferable approach. I had put forth a similar proposal quite some time ago (please refer to the thread [Feature Request] A Better Tool for Drawing Commutative Diagrams), though regrettably, it didn’t generate any discussions.
In my view, it would be more advantageous for a commutative diagram tool to integrate with the existing graphics tool, which already offers numerous valuable features. It would be nice to initiate this project by enhancing the capabilities of functions such as Arrow-with-text and Arrow-with-text* within the graphics tool. Similar to how quiver operates, automatically attaching arrows to the starting and ending formula boxes would greatly enhance the usability of the tool.
I agree that enhancement in arrows is needed in order to produce more decent-looking commutative diagrams.
iirc only regular arrows and dashed ones are supported in (make-cd).
Here is a list of arrow tips from tikz-cd manual (https://ctan.math.washington.edu/tex-archive/graphics/pgf/contrib/tikz-cd/tikz-cd-doc.pdf), most of which aren’t yet supported in the built-in commutative diagram tool:
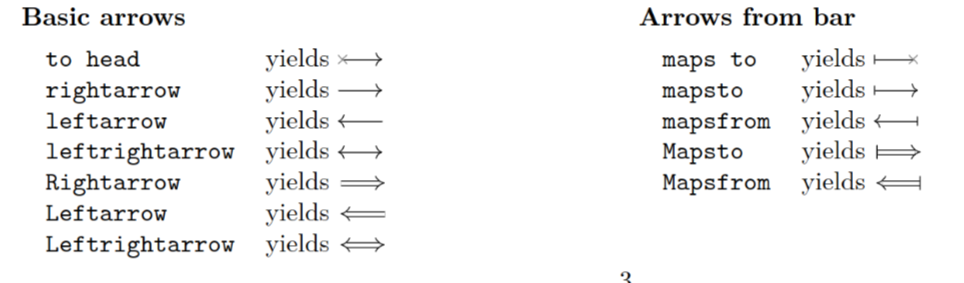

afaik tikz-cd has lots of another features, such as
- allowing arrows to bend left or right
- “3d” commutative diagrams
- …
Improving the arrows seems to be a good place to start 
I’m not sure whether deep binding with the existing graphics tool would be ideal, since the positions tend to be hard coded there.
It seems to me that the graphics tools has too much functionalities that aren’t useful for making commutative diagrams. imo one of the reasons why tikz-cd and quiver are so popular is that they don’t give users full freedom in the placement of vertices and arrows. While tikz-cd uses tikz under the hood, it only exposes a small subset of tikz's functionalities.
1 Like
I completely understand your point. Indeed, there already exists a commutative diagram mode in TeXmacs (accessible in math mode by clicking the graphics tool icon → Commutative diagram).
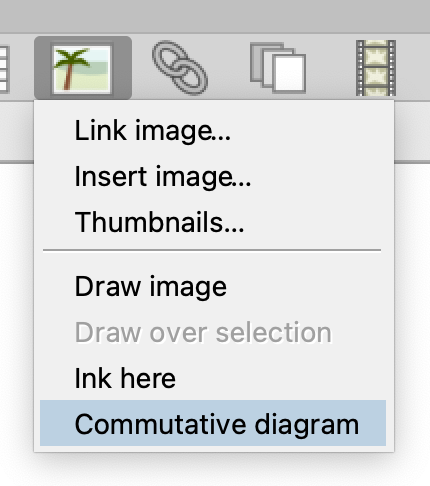
This mode is for now nothing but the graphics mode with only few distinct default settings tailored for creating commutative diagrams.
By integrating a better commutative diagram mode with the existing graphics tools, you can leverage the functionalities already present and avoid starting from scratch. This approach also allows for the deactivation of any functions that aren’t pertinent to this specific purpose, potentially making the development process easier.
I do not tend to agree with this. The “commutative diagram” mode is not quite different from the usual mode, and as previously mentioned, the (absolute) coordinates are hard-coded and this seems very different from tikz-cd or xypic.
There is another practical reason for something similar to tikz-cd or xypic: at least, to (pre)publish a scientific article, we convert TeXmacs to LaTeX, and it would be easier if the commutative diagram can be easily converted into tikz-cd or xypic.
Dear @re4zuaFe,
I apologize if there was any confusion in my previous message. What I meant to convey is that while the current “commutative diagram” mode is far from mature, it does provide a foundation upon which we can build better tools.
In terms of LaTeX export, I have previously discussed this in my earlier thread [Feature Request] A Better Tool for Drawing Commutative Diagrams. This is one of the reasons why I find quiver to be an exceptional tool, as it automatically generates TikZ code. If we could incorporate certain algorithms from quiver, it would allow us to maintain TeXmacs as a WYSIWYG editor for commutative diagrams, just as it is for other aspects of scientific editing. This way, we can continue to enhance the user experience and streamline the process.
1 Like