The link to tm-forge from www.texmacs.org would still be nice. But the whole discussion is probably best for a Jolly Coders meeting.
Challenge: create support for commutative diagram
I mean, just put these nodes into cells of a tabular, and allow arrows to be added between cells. An algorithm is needed to determine how the cells are stretched. I am not sure whether this is implementable via scheme codes.
More precisely, in the second example, we start with the tabular
<tformat|<table|<row|<cell|\<pi\><rsub|1><around*|(|X\<cap\>Y|)>>|<cell|\<pi\><rsub|1><around*|(|Y|)>>|<cell|>>|<row|<cell|\<pi\><rsub|1><around*|(|X|)>>|<cell|\<pi\><rsub|1><around*|(|Y|)>\<ast\><rsub|\<pi\><rsub|1><around*|(|X\<cap\>Y|)>>\<pi\><rsub|1><around*|(|X|)>>|<cell|>>|<row|<cell|>|<cell|>|<cell|\<pi\><rsub|1><around*|(|X\<cup\>Y|)>>>>>
Then we specify the remaining arrows. I am not sure how to interact with TeXmacs typesetting algorithms appropriately to have good spaces between these nodes.
1 Like
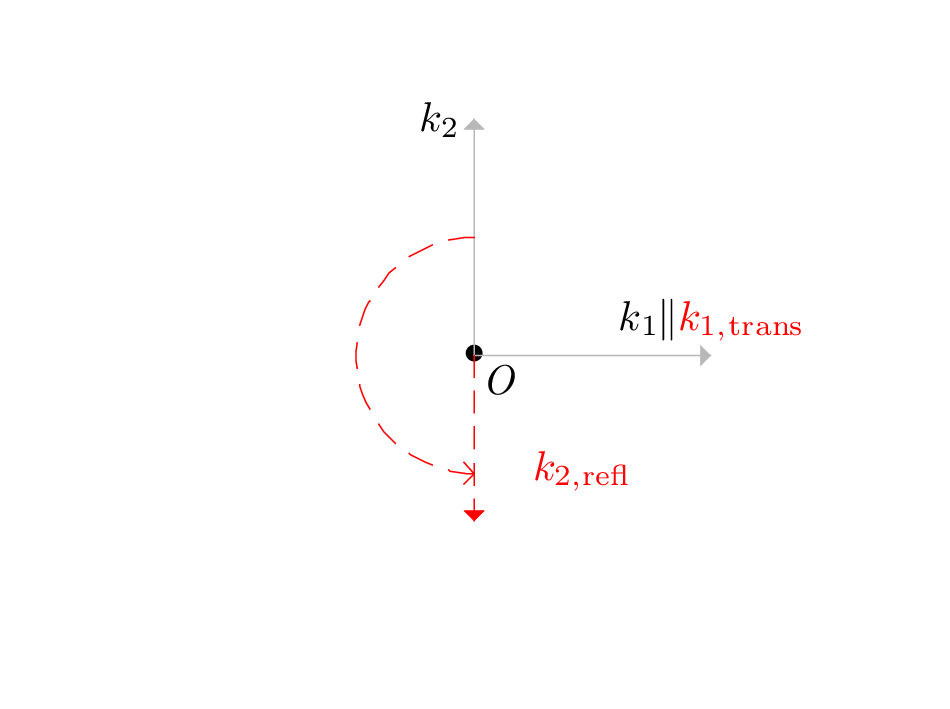
An image instead of code  ; made with Scheme graphics.
It took a bit of time to set-up the functions, but after that it is quicker to use them. Recurringly, I get slowed down because I forget which functions I defined, so I stopped using the functions 
I think I need (I am telling this to myself)
- a good way of documenting the available functions so that they are easy to pickup after three months I am not using them
- improvement of the syntax I am using; perhaps with some macros.
Here is the code that generates that image; I do not include any of the supporting code, it is just to give the idea. Also, comments are notes that I took when testing; if they are confusing it is because I was confused myself.
(define k-1 (phasor 0 1 'color "grey"))
(define k-2  (phasor 90 1 'color "grey"))
(define k-2-refl (phasor -90 0.7 'color "red" 'dash-style "11100"))
(define k-1-mark-text
  '(math
    (concat "k" (rsub "1") "<||>"
	    (with color "red"
	      (concat "k" (rsub "1, trans"))))))
(define k-2-mark-text
  '(math
    (concat "k" (rsub "2"))))

(define k-2-refl-mark-text
  `(with color "red"
     (math
      (concat "k" (rsub "2,refl")))))

(define k-1-mark (mark-line k-1 k-1-mark-text 1))
(define k-2-mark (mark-line k-2 k-2-mark-text 1))
;; 2021-03-09 it seems to complete the drawing, adding the red dashed arc,
;; which is later in the scheme-graphics list, even if k-2-mark is defined
;; "recursively" writing k-2-mark instead of k-2-mark-text; the terminal does
;; not report any error.

;; I do not know how but TeXmacs retained a previous definition of k-2-mark;
;; the mark text was placed in a position such that I did not notice it
;; immediately. Restarting TeXmacs made the command with k-2-mark fail with
;; "unbound variable", as it should

;; As observed in another case as well (same day 2021-03-09) a variable defined
;; through mark-line is a valid input for the txt argument of mark-line; the
;; positioning is quite off with respect to the positioning of "bare text" one
;; sets with the positioning input to mark-line To investigate this, one should
;; experiment with placing "text-at" markup in the text argument of text-at
;; markup (since the output of mark-line is a "text-at" markup)
(define k-2-refl-mark (mark-line k-2-refl k-2-refl-mark-text .7 .6))

(define scheme-drawing
  (scheme-graphics "8cm" "6cm" "center"
		   `((point 0 0)
		     ,(mark '(point "0" "0") "O" "SE")
		     ,k-1
		     ,k-2
		     ,k-2-refl
		     ,k-1-mark
		     ,k-2-refl-mark
		     ,k-2-mark
		     (with arrow-end "<gtr>"
		       color "red" dash-style "11100"
		       ,(arc-polar '(0 0) 1 90 270))
		     )))
Finally, @re4zuaFe, Scheme is fun
2 Likes
Sorry, this is different from what I imagine. I mean, I am thinking of commutative diagrams, and I wonder whether it is possible to write up some scheme codes to intervene the typesetting algorithms in TeXmacs, so that the user do not have to concern about the coordinates of each node. I think that the commutative diagrams in these examples explain well.
1 Like
Well, those are produced starting from node coordinates: https://gitlab.com/giacomogallina/typst-cd/-/blob/main/example.typ
But I think I know what you mean. As a first step, I would see if it is possible to create a “diagram node” entity in a TeXmacs drawing such that the entity has only a few points, somewhat distant from it, at which arrow ends can snap. If I find out anything I’ll report.
I do not think automatic placement is what you want. Parametric drawings. I guess you need to leave the user the choice on where to put vertices and which arrow to have and then the system should compute the precise location of the start/end of the arrows, etc… But again, this would require a lot of complex decisions which is not clear which criterion to use. It is just a diagram after all. All the user need is a fast way to produce a lot of similar diagrams. I’m fine with the approach of q.uiver.app : a grid where to place the vertices and arrows defined by some parameters. If you have rapid visual feedback things are fine. Our graphic editor has already much of the functionality but you would like to have a larger grid for a solid placement of the vertices and an easier way to parametric arrows and to choose their starting/ending points attached to some label, so that if one move the label, then also the arrows are moved.
Current TeXmacs arrows are UGLY. We deserve better arrows. Otherwise they are essentially useless.
2 Likes
I exactly take advantage of automatic placement (and so are all examples). Currently, I am using the Graph plugin with XYpic to do this. It basically satisfies my needs, but it is ugly, with very few source-code interaction with TeXmacs, and would lead to extremely large tm files (since compiled binary images are embedded), and a recompilation might lead to a different binary image which will mislead versioning tools.
Many of these sort of diagrams could be mimicked by tabulars, and this is why I would see it as an extension of tabulars. However, the mimic is ugly. For example:
<\equation*>
  <tabular*|<tformat|<table|<row|<cell|Hom<rsub|\<cal-C\>><around*|(|X,<big|oplus><rsub|i>Y<rsub|i>|)>>|<cell|\<longrightarrow\>>|<cell|Hom<rsub|\<cal-D\>><around*|(|F<around*|(|X|)>,F<around*|(|<big|oplus><rsub|i>Y<rsub|i>|)>|)>>>|<row|<cell|\<longdownarrow\>>|<cell|>|<cell|\<longdownarrow\>>>|<row|<cell|G<around*|(|Y|)>>|<cell|\<longrightarrow\>>|<cell|H<around*|(|Y|)>>>>>>
</equation*>
and
<\equation*>
  <tabular*|<tformat|<cwith|1|1|2|2|cell-row-span|1>|<cwith|1|1|2|2|cell-col-span|3>|<table|<row|<cell|A>|<cell|\<longrightarrow\>>|<cell|>|<cell|>|<cell|C>>|<row|<cell|\<longdownarrow\>>|<cell|>|<cell|>|<cell|>|<cell|\<longdownarrow\>>>|<row|<cell|B>|<cell|\<longrightarrow\>>|<cell|R>|<cell|\<longrightarrow\>>|<cell|D>>>>>
</equation*>
1 Like
I do not think this would work. Vertices are on a grid, but arrows can jump arbitrarily far, so they cannot be represented faithfully as cells of a table. Arrows are edges, so they are associated to pairs of vertices. I’m not sure also what you mean by automatic placement: in the example cited the vertices are manually placed in a grid, the automatic placement takes place for the start/end points of arrows, and I agree this can be done by a computer. However the bending of the arrows is matter of style and visual result and I think should be allowed to be hinted by the human, so you need a way to associate attributes to the arrows (+ labels). I do not see how you can do substantially better than something like
#align(center)[#commutative_diagram(width: 300pt, height: 200pt,
  node((0, 0), [$pi_1(X sect Y)$]),
  node((0, 1), [$pi_1(Y)$]),
  node((1, 0), [$pi_1(X)$]),
  node((1, 1), [$pi_1(Y) ast.op_(pi_1(X sect Y)) pi_1(X)$]),
  arr((0, 0), (0, 1), [$i_1$], label_pos: -1em, "inj"),
  arr((0, 0), (1, 0), [$i_2$], "inj"),
  arr((1, 0), (2, 2), [$j_1$], curve: -15deg, "surj"),
  arr((0, 1), (2, 2), [$j_2$], label_pos: -1em, curve: 20deg, "def"),
  arr((1, 1), (2, 2), [$k$], label_pos: 0, "dashed", "bij"),
  arr((1, 0), (1, 1), [], "dashed", "inj", "surj"),
  arr((0, 1), (1, 1), [], "dashed", "inj"),
  node((2, 2), [$pi_1(X union Y)$])
)]
What we can offer more than that is that labels can be edited directly in the resulting graph.
Thanks. I mistakenly thought that the spaces are variable, but after looking at those tools, it seems that the vertical and horizontal spaces are fixed respectively, and only the heads and tails of arrows are adapted.
However, realizing diagrams as tables seems to make this possible: such a table could be associated with values of “horizontal distance” and “vertical distance”, which indicates the distances between cells. For example, the distances for normal tables are zero.
I did not mean to represent arrows as cells of a table in general (the two mimics are indeed so).
I also suffer from editing source code inside TeXmacs, here is a solution:
(delayed (lazy-keyboard-force)
  (kbd-map
   (:mode in-prog?)
   ("A-c E" (let ((fn (url-glue (url-temp) ".code")) ;; TODO: add extension name
                  (snippet (tree-search-upwards (cursor-tree) 'document)))
              (tree-export snippet fn "verbatim")
              (system-1 "emacsclient -a 'nvim-qt --nofork' " fn)
              (let ((t (tree-ref (tree-import fn "verbatim") 0 0)))
                (tree-set snippet t)
                ;; without return and backspace, you cannot edit the same snippet twice
                (kbd-return)
                (kbd-backspace))))
   ))
Replace the editor if you want.
Are there any updates on the development of commutative diagram support in TeXmacs? I’m a big fan of TeXmacs, but the lack of adequate support for commutative diagrams (such as tikz-cd in LaTeX) is preventing me from using it on a daily basis instead of org-mode or plain LaTeX.
I may not have much experience in typesetting or programming in Scheme, but I think it would be beneficial for someone well-versed in the internals of TeXmacs to outline a roadmap for implementing commutative diagram support. This way, individuals like me who are interested in this feature could gradually explore the existing codebase, familiarize ourselves with the requirements for implementing the roadmap, and potentially contribute to realizing this feature  .
.
@mafty Welcome to our forum!
There are at least three ways to create commutative diagrams in TeXmacs.
-
If you are already familiar with the fantastic tool quiver, the
quiver-plugin would be an excellent choice. You can download it here and install it into TeXmacs yourself. Additionally, the plugin is built-in to Mogan. -
While TeXmacs doesn’t have a specific
TikZ-cd-plugin, it does offer built-inTikZ- andXY-pic- plugins, both of which are traditional tools in LaTeX for drawing commutative diagrams. -
The built-in graphics tools are also very well-designed for various graphics, including commutative diagrams. Despite some imperfections, they are more than sufficient for daily use. I recommend you read Chapter 8 of The Jolly Writer or watch Joris’ tutorial to familiarize yourself with this wonderful tool.
You can choose any of these options according to your preferences. Additionally, a student participating in Mogan Summer of Code is working on improving the graphics tools, with one of the goals being to enhance the functionalities of commutative diagram drawing. Feel free to submit issues with your suggestions to Mogan. Your contributions are welcome!
Hi, @xuyiqi.
In my opinion, having built-in support for commutative diagrams represented as native tree structures is much more preferable. As far as I know, the diagrams produced by the quiver plugin and tikz/xy-pic plugins rely on inserting binary files generated by external programs.
I have also experimented with the built-in graphic tools, but they necessitate manual placement of anchors and arrows using the mouse, which compromises the scalability of the approach.
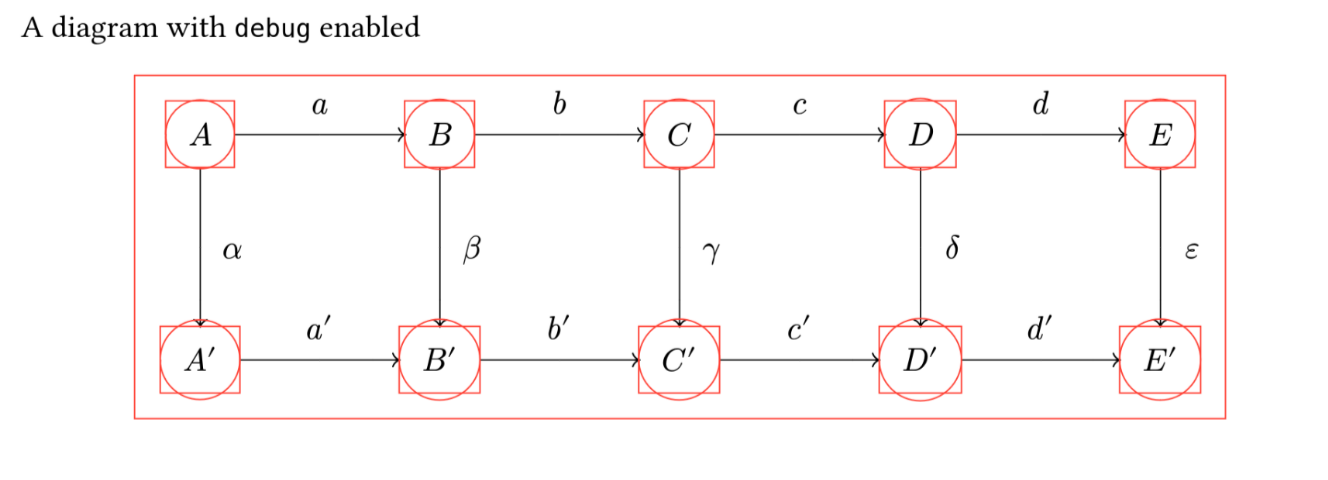
This is a screenshot from the pdf document produced by https://gitlab.com/giacomogallina/typst-cd.
Is there someone knowledgeable about the typesetting engine who could provide guidance on the following:
- How can I obtain geometric information similar to the rectangular bounding boxes for an inline math environment (such as
A'in the example)?
Based on the screenshot provided, it appears that by determining the geometry of all these bounding boxes, we could develop an algorithm to automatically calculate the start and end positions of arrows connecting them.
I would like to attempt a minimal example where I connect two inline math environments with an arrow, with the start and end positions of the arrow computed automatically. Any insights or suggestions would be greatly appreciated.
I guess that this (connecting two inline math environments) would make things more complicated than necessary, if I understand correctly.
I don’t know anything about typst-cd, but my current understanding of XYpic is that, the grid (i.e. the horizontal and vertical distances) are fixed, not computed, that is to say, it does not adapt to contents, and when the distances are not good, users have to adjust them manually.
Hi @re4zuaFe,
I haven’t used xypic in LaTeX before. However, according to my experience of using tikzcd, by default the centers of the vertices are arranged in a grid, but the algorithm would automatically figure out
- the best way to place arrows between them, so there is a consistent spacing around the formulas at the vertices.
- the horizontal and vertical distances in the grid
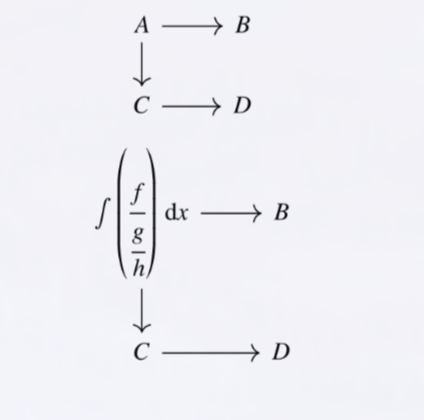
Here is a minimal example using tikz-cd:
 \begin{displaymath}
  \begin{tikzcd}
    A\ar[r] \ar[d] & B \\
    C \ar[r] & D
  \end{tikzcd}
\end{displaymath}

\begin{displaymath}
  \begin{tikzcd}
    \int \left( \cfrac{f}{\cfrac{g}{h}} \right) \, \mathrm d x \ar[r] \ar[d] & B \\
    C \ar[r] & D
  \end{tikzcd}
\end{displaymath}
which produces the following diagrams with distinct grid sizes and arrow lengths: