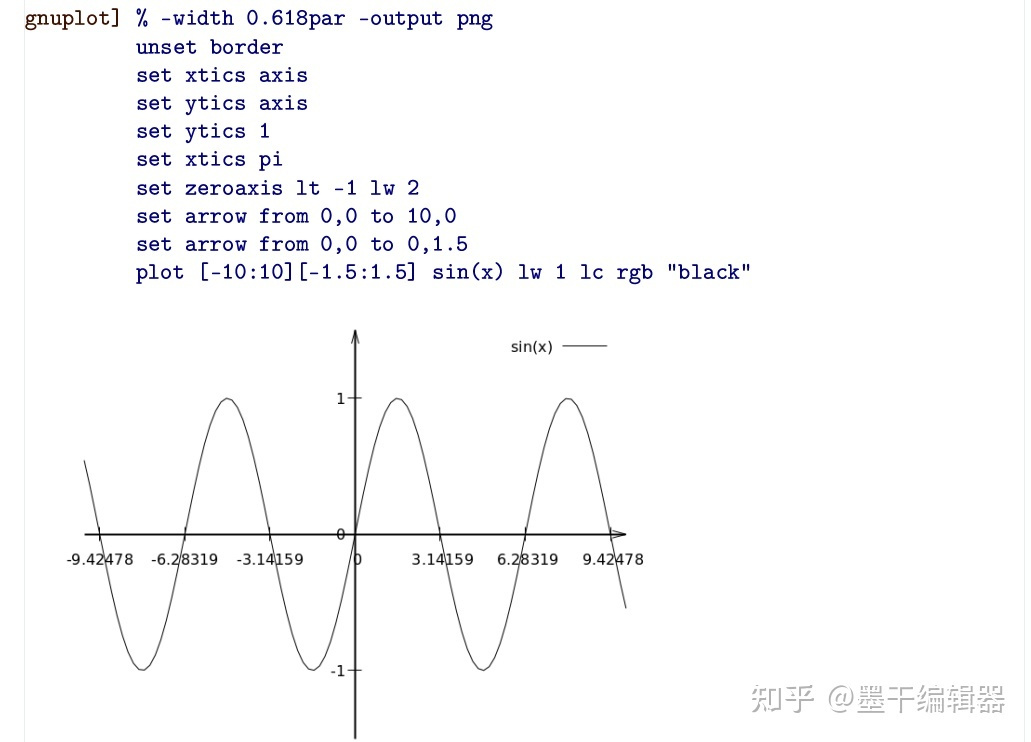
Here is the code snippet:
% -width 0.618par
unset border
set zeroaxis lt -1 lw 2
set xtics axis
set ytics axis
set ytics 1
set xtics pi
set arrow from 0,0 to 10,0
set arrow from 0,0 to 0,1.5
plot [-10:10][-1.5:1.5] sin(x) lw 1 lc rgb "black"
Here is the code snippet:
% -width 0.618par
unset border
set zeroaxis lt -1 lw 2
set xtics axis
set ytics axis
set ytics 1
set xtics pi
set arrow from 0,0 to 10,0
set arrow from 0,0 to 0,1.5
plot [-10:10][-1.5:1.5] sin(x) lw 1 lc rgb "black"
Hi,
How to obtain π, 2π, 3π etc. on the x axis instead of 3.14159, 6.28319, 9.42478 ?
I didn’t find how to show pi on the axis yet.
My impression is that asymptote is more versatile, and also supported by TeXmacs. But really never tried it. When I need to plot things I usually do it with matplotlib.
Here is the deps on Debian sid for Asymptote.
Depends: tex-common (>= 6.13), python3:any, freeglut3 (>= 2.8.1), libboost-filesystem1.74.0 (>= 1.74.0), libboost-thread1.74.0 (>= 1.74.0), libc6 (>= 2.33), libcurl3-gnutls (>= 7.16.2), libfftw3-double3 (>= 3.3.5), libgc1 (>= 1:7.2d), libgcc-s1 (>= 3.0), libgl1, libglew2.2 (>= 2.2.0-4), libglx0, libgsl27 (>= 2.7.1), libreadline8 (>= 6.0), libsigsegv2 (>= 2.9), libstdc++6 (>= 12), libtinfo6 (>= 6), libtirpc3 (>= 1.0.2), zlib1g (>= 1:1.2.3.3), ghostscript, imagemagick, texlive-binaries, texlive-latex-base, texlive-pstricks, texlive-plain-generic, xdg-utils
Installing texlive on Windows is time consuming. I think math teachers in high school will not love the idea to install texlive/asymptote/texmacs to make slides.
Here are two related stackoverflow questions:
https://stackoverflow.com/questions/24648086/how-do-i-include-greek-letter-in-gnuplot/24653552
https://stackoverflow.com/questions/40824152/how-to-show-π-symbol-on-x-axis
Thank you very much Sadhen.