Dear @Tilda,
many thanks for testing octaveX.
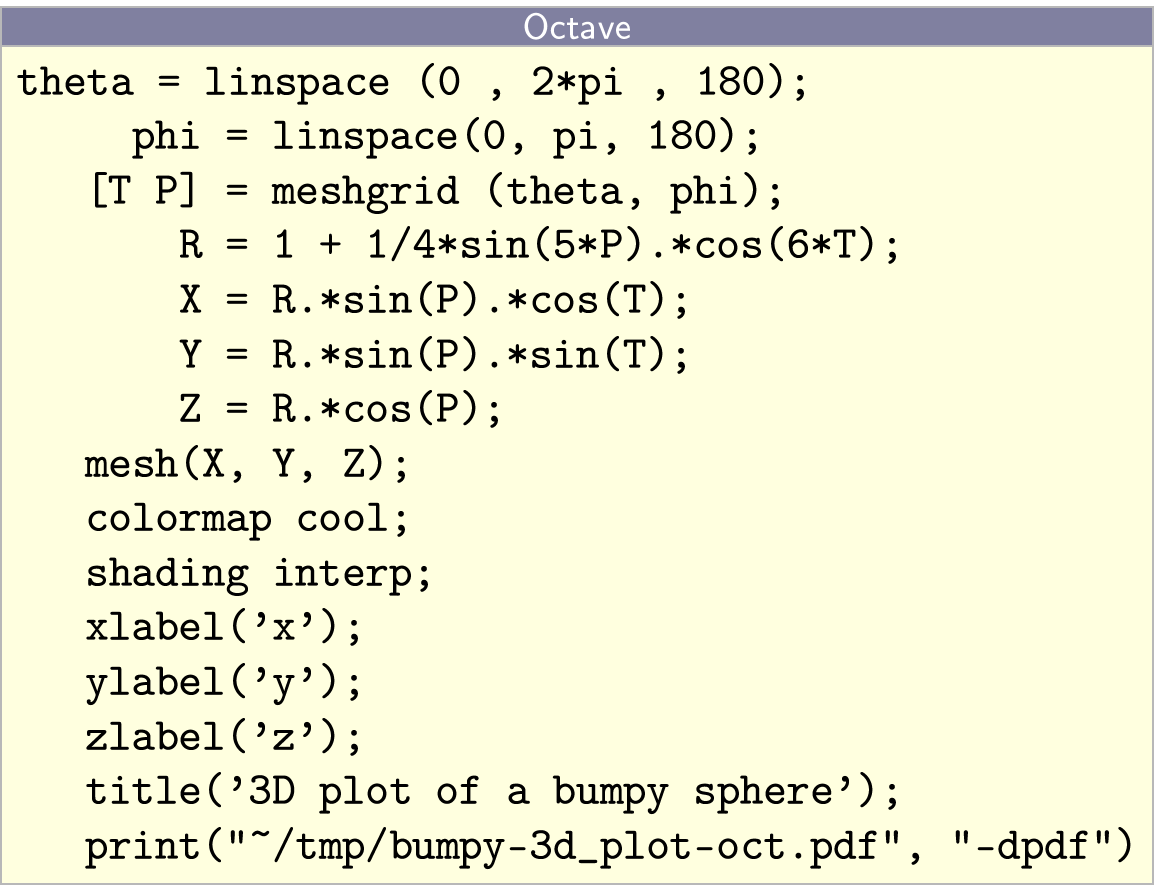
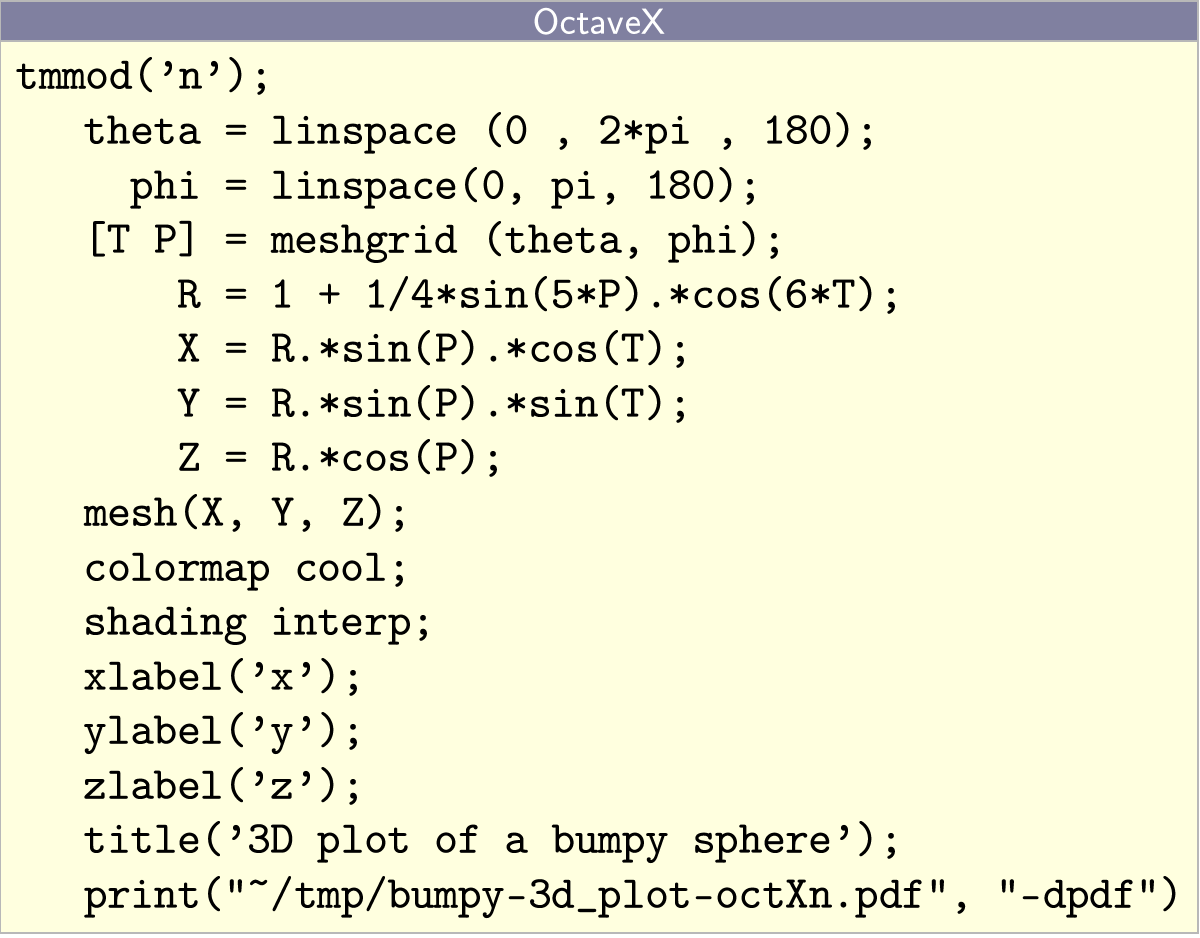
The quality of plots is because my main use of TeXmacs (and motivation to write ocatveX) is to obtain in graphical form behavior of models, or plotting data and so on so I focused on that.
Concerning your issues:
- the strange behavior of ‘ans’ is my fault, because ‘ans’ was redefined by mistake in octaveX. Thanks for spotting this issues.
Fixed. (changing the internal variable ‘ans’ to ‘octaveXans’).
BTW, the strange numbers you got were the ascii codes of the word ‘texmacs’…
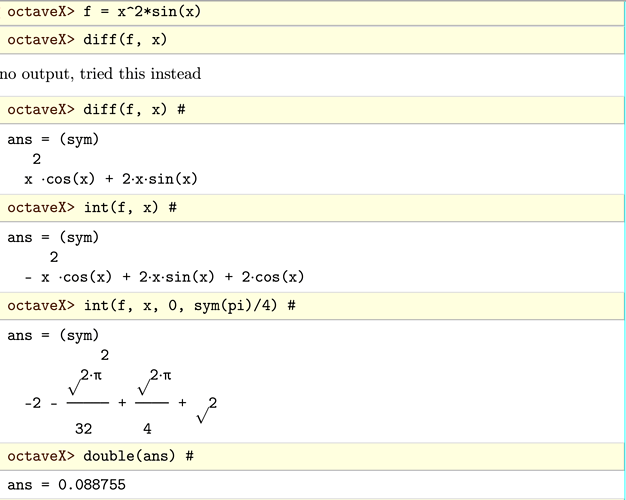
Now this works, see below: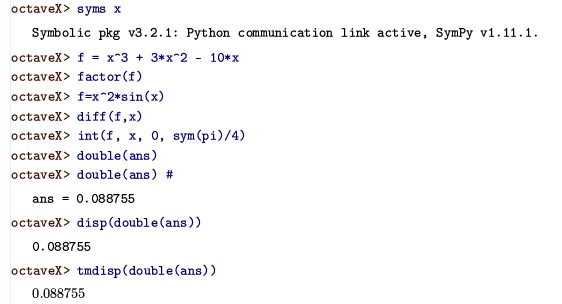
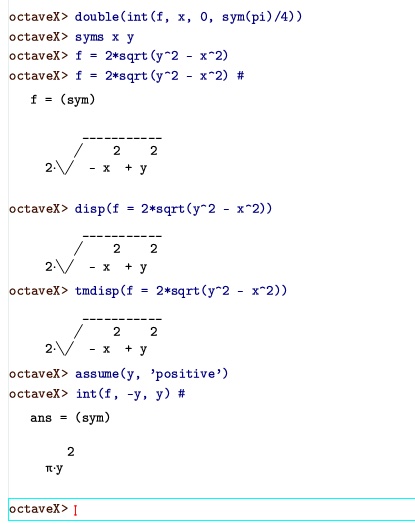
Just one more comment on that: you may note that the ‘double(ans)’ command has no output, while the three rows immediately below have.
This because octaveX adds to every input a semicolon at the end, to avoid excessive outputs (this behavior was actually inherited from a very ancient octave plugin. I decided to maintain it, makes sense if you are interested in graphical output only…).
In a future version I may add a switch to control this, but at the moment there are three ways to overcome that:
a. add a # at the end of the command, this makes the semicolon become a comment, or,
b. asking to explictely display the output with the standard octave disp() command, or
c. use tmdisp(), a display command defined in octaveX, which try to print the output in a fancier way (e.g. for vectors and matrices)
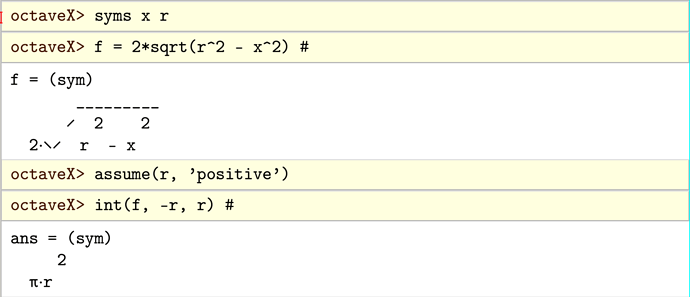
- Your second issue. My feeling is that here there is a similar problem, I need to investigate better, but it will take some time. I think so because if you do the same computation e.g. using as symbols x and y, instead of x and r, everyting is just fine (see next post: it seems I cannot post two images at once…) So probably something concerning the symbol ‘r’ is hidden somewhere in octaveX.
Again to obtain the output we need to force it with the ‘#’ at the end of the lines.
Once I can fix this second issue I will release an updated version.
Best,
Lorenzo


