Plotting functions with TeXmacs graphics

I have written a small set of Scheme files to plot functions using the graphics of TeXmacs. I put it at https://github.com/pireddag/plotFun, with short instructions on how to use it.

The code can be improved a lot and it is not well-documented (I am starting already to forget what I wrote in there); for example the plot parameters (at the moment they are the function and the range) could be supplied with a file rather than as parameters of the macro; and of course writing the function to be plotted in standard notation would also be nice, but I do not have time for this immediately.

I would appreciate, though, if someone tries it and tells me whether it works on their computer. In the github project there is a test file and its pdf output (test_plotting_Scheme.tm and test_plotting_Scheme.pdf).
A thing that I would like to improve is the placement of the tick labels: I think that to place them right I should know how long each typeset string is, but I do not know how to get this information and to pass it onto the Scheme code. I would appreciate suggestions on this too.

Giovanni

3 Likes

Hi:
Thanks a lot it is a great improvement
I work in windows 10
I have downloaded, drop all the files at the suggested folder C:\Program Files x86\Texmacs\progr\graphics and the function does not work.

1st The name of the folder is graphics, not Graphics as you suggest. I do not know it it is so relevant
2nd How does one exactly load the package
3rd At the folder C:/users/…/AppData/Roaming/TeXmacs/progrs/graphics is it necessary to drop some files?

Regards

Hi,
thanks for trying :slight_smile:
I have tested it on Linux so far. Let me check how it works on Windows and I will get back to you.

Of course the program will be usable for documents once some important details are added (axes labels, possibility of plotting more than one function, choose colors for lines, more precise placement of tick labels, option for exponential notation and of course there are more).

G.

As a TeXmacs developer, I failed to make your code work in 10 minutes.

There is an example plugin, you may reorganize your code:

@darcy on which operating system did you try the code? I tested it on Linux only, as on Windows I have not yet figured out where is the TeXmacs user directory.

@darcy (and @Pdiazs) On Windows there is something fishy going on, I am suspecting a bug.

I have put things temporarily in TeXmacs own directories (not in the user directories, as I do not know where they are). I have made a subdirectory of packages\example which I called _personal and I put the packages there. I happen to have there several packages, among them there is a package called SIUnits (it is as well in my GitHub account). If I load plotFun alone, the plotFun macro does not work. If I load plotFun and SIUnits, plotFun works (!), except for the first instance of use; this although the two packages are unrelated. I can investigate this a bit better this evening, and it would be very nice if someone would tell me where to put things in Windows. I will also reorganize my code copying the organization of Karl Hegbloom.

I’m using GNU/Linux. (Debian)

Ok, there it should work (I use Xubuntu). I will reorganize the code this evening and maybe you can try again.

@darcy done, will reorganize again following the suggestion of JvdH on the mailing list, but maybe what I did is already enough to make it possible for you to get the package to work on your computer.

It works fine now.

Note: I have taken extra steps:

Click Edit->Preferences..., switch to the Other tab and then use Accept all scripts for Security.

Here is the mail list archive link:

https://lists.texmacs.org/wws/arc/texmacs-users/2019-11/msg00030.html

I have improved a bit the package for TeXmacs that plots functions that I placed at https://github.com/pireddag/plotFun

  • It can now plot several functions in the same graph (but all in blue :slight_smile: )

  • Following up on a suggestion from Max, I am evaluating the arbitrary user-provided code that the program needs to plot the functions using a “safe module”. In this module a restricted set of commands is available (I learnt about that from here: https://www.mail-archive.com/guile-user@gnu.org/msg00963.html, as far as I understand for the Guile 2/3 series there is a different method).

I do not know how safe is the program now, but I hope that it is now difficult damaging your computer by placing “the wrong code” as an argument to the function-plotting macro. I would appreciate very much comments on the safety of the program, as I know very little (almost nothing) on this topic.

I have in mind to add a series of colors with which successive functions will be plotted - if/when I do that I will post again.

Giovanni

(P.S. I tested it only on Linux: for Windows, I did not yet figure out where to place the package and the Scheme files: maybe someone can tell me?)

Done - I have written it using strings for colors, I have tried triplets of numbers (as (list 0 0.5 0) for example) but I obtain a gray color (so I know that (list 0 0.5 0) is not interpreted as RGB).

You can define your own colors changing in the file setColors.scm the definition of colorList. For example:

(define colorList
'(“blue” “red” “green” “magenta” “cyan” “yellow”))

On a different theme, input syntax is extremely finicky, I have seen (once) incorrect syntax causing an error which wasn’t “obviously” telling what’s wrong. I could write an input parser which tells users whether their input file is ok or not.

Last for today: HTML codes work (learnt it looking at the source code of a drawing), so

(define colorList
'(“blue” “red” “green” “#007f00” “cyan” “yellow”))

is also possible.

After about 6 months: I “played” a bit with the Windows version of TeXmacs and I have been able to make the Scheme files work with it. I have the impression now that when I read your message (in November '19) I did not realize that C:/users/…/AppData/Roaming/TeXmacs/ is the directory for the user files.

I did in this way. I placed all of the Scheme files (the ones in https://github.com/pireddag/plotFun/tree/MultipleFunctionsSafeWorking/progs/graphics/plotting) in

C:\Users…\AppData\Roaming\TeXmacs\progs\graphics\plotting

(where the ellipsis … stands for the username)

and the package in

C:\Users…\AppData\Roaming\TeXmacs\packages\Graphics

(I do not think that where you place the package matters, as the package has inside itself the information on where to look for the Scheme files).

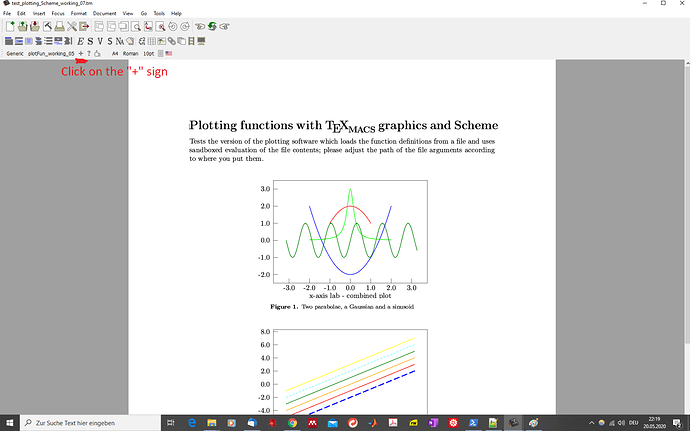
Then you load the package with the “+” button in the lower part of the upper bar.
There will be a directory “Graphics” appearing in the list of directories and inside that the package that you put there.

I still have to place something in order so that everything is straightforward but I hope it is enough. I attach an image of the TeXmacs window with the “+” button in evidence.

There is still substantial work to do before one can use this package for his own documents - the main thing that I see is improving the calculation of the position of the x-label; and I do not know how to place a label for the y-axis, as I do not know how to write text in the vertical direction (can only write horizontal text). But maybe something good will come out of this.

Finally, sorry for taking six months to answer you properly. At the beginning I was convinced that I would not find where to put the files in Windows, I changed my mind when I saw the location of the files in your message :slight_smile:

1 Like

I have added options so that each plot can be customized: color, line style, line thickness, number of points. Moreover a graph can have a title and labels for the x- and y-axes; the size of the graph can be set by the users. All options have default values (there is a cycle list for colors which I took from gnuplot).

There is still considerable work to do, but I think the program at the moment can be used for private documents. Examples of needed things are - improve the placement of graph elements: tick labels, axes labels, title; refine the size of the tick marks; exponential notation for tick labels; either change the input syntax or write a parser that checks it; add a legend; add plots of data points.

Also, to further annotate the graph once that it has been generated it is necessary to “ink over” it (select it and then Insert->Image->Ink here). To do some changes to the graph itself one has first to deactivate the “ink here” macro, then it will be possible to deactivate the plotFun macro. The third graph in the documentation (not yet in the file with the examples only) has an example.

I know that Joris has written a plotting utility, I am insisting with mine as doing it is fun

Giovanni