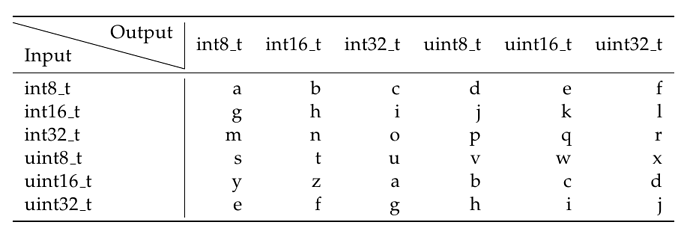
Not that I know of but you can use ‘Draw->Ink here’ to insert a graphical overlay and draw a line and the text in the graphical environment. Or even more easily, introduce a graphics environment in that cell and place the elements in the graphics.
An example (copy here and “Paste from… -> TeXmacs”):
<\wide-block>
  <tformat|<cwith|1|1|1|1|cell-halign|l>|<cwith|1|1|1|1|cell-width|4cm>|<cwith|1|1|1|1|cell-hmode|exact>|<cwith|1|1|1|1|cell-lsep|0em>|<cwith|1|1|1|1|cell-rsep|0em>|<cwith|1|1|1|1|cell-bsep|0em>|<cwith|1|1|1|1|cell-tsep|0em>|<table|<row|<\cell>
    <with|gr-mode|<tuple|edit|text-at>|gr-frame|<tuple|scale|0.999986cm|<tuple|0.5gw|0.5gh>>|gr-geometry|<tuple|geometry|0.266694par|0.133352par|center>|gr-grid|<tuple|empty>|gr-grid-old|<tuple|cartesian|<point|0|0>|1>|gr-edit-grid-aspect|<tuple|<tuple|axes|none>|<tuple|1|none>|<tuple|10|none>>|gr-edit-grid|<tuple|empty>|gr-edit-grid-old|<tuple|cartesian|<point|0|0>|1>|gr-transformation|<tuple|<tuple|0.9553364891256058|0.0|0.29552020666133955|0.0>|<tuple|0.0|1.0|0.0|0.0>|<tuple|-0.29552020666133955|0.0|0.9553364891256058|0.0>|<tuple|0.0|0.0|0.0|1.0>>|<graphics||<text-at|Input|<point|0.3761637809859271|0.34264358122075045>>|<line|<point|-2.0182732218749484|1.0085330158257677>|<point|1.9783532602404459|-0.9967918506391493>>|<text-at|Output|<point|-1.6126407699558467|-0.5979395081940103>>>>
  </cell>|<\cell>
    \;
  </cell>|<\cell>
    \;
  </cell>>|<row|<\cell>
    \;
  </cell>|<\cell>
    \;
  </cell>|<\cell>
    \;
  </cell>>>>
</wide-block>

